decision intelligence dashboard

Turn data overload into clear business decisions.

Lumethica designs decision intelligence dashboards that combine data, AI recommendations, scoring, confidence and human action flows - so teams know what to do next.

Short definition

What is Decision Intelligence Dashboard?

A Decision Intelligence Dashboard turns business data into prioritized recommendations, confidence signals and next-best actions so teams can make better decisions with less manual analysis.

  • Designed around a real workflow
  • Connected to business data and user outcomes
  • Includes trust and control assumptions

Pain diagnostic

Dashboards show what happened. Decision systems show what to do next.

Most companies already have reports, dashboards and analytics. The missing layer is decision clarity: which customer needs attention, where risk is rising, why the recommendation matters and what the team should do now.

Lumethica Decision OS
07:42Live

Revenue intelligence

Expansion & churn prediction

OverviewSignalsActionsLogs
Model typeDecision support
Model qualityVery high
RecalculationDaily
Predictions50,368
Analyzed segmentB2B accounts with onboarding or expansion signalsShow conditions
Distribution by risk labelProfiles
23.4k5.3k4.3k7.2k9.9k
Very lowLowMediumHighVery high
Decision labels
Very low23,47246.61%
Low5,36710.66%
Medium4,3128.56%
High7,25214.4%
Very high9,95919.77%

Priority interface

Translate data into priorities and recommended actions.

Scoring logic

Design signals for customers, leads, risk, operations or product usage.

Human action flow

Make confidence, explanation and decisions visible to users.

What we build

Decision support interfaces for repeated business decisions.

  • Customer health and churn-risk dashboards
  • Sales intelligence and lead scoring interfaces
  • Next best action systems
  • Product usage intelligence
  • Risk signal dashboards
  • Operational decision centers
  • Insurance or financial decision-support interfaces

What you get

02

Signal and scoring model

Define which business signals matter and how they become useful decision labels.

03

Recommendation UX

Show what to do next, why it matters and how confident the system is.

04

Human action workflow

Connect insights to accepted, rejected, delegated or completed business actions.

05

Executive and audit view

Make outcomes, reasoning and action history visible for teams and leadership.

Process

From signals to a decision-ready MVP spec.

1

Decision mapping

Define repeated decisions and users.

2

Signals

Inventory data and scoring assumptions.

3

Dashboard UX

Design priorities, views and decision flow.

4

Explanations

Add confidence, evidence and recommendations.

5

Rollout plan

Specify MVP, metrics and iteration path.

Why this matters

Priorities create more value than raw data.

Decision velocity increases when teams see priorities, trust increases when AI explains why something is recommended, and business value becomes measurable through accepted or rejected recommendations.

FAQ

Common questions.

Do we need a trained ML model?

Not always. The first version can use business rules, heuristics, scoring logic or existing analytics before predictive models.

What data is required?

Common sources include CRM, product analytics, support tickets, documents and operational systems.

Can this work for sales or customer success?

Yes. Sales, customer success, product, operations and risk teams are strong fits.

How is this different from BI?

BI explains past performance. Decision intelligence helps prioritize next actions with AI-assisted reasoning, scoring and human approval.

Related services

Build trust and agents around decisions.

Explainable AI Interface DesignMake recommendations understandable and actionable.AI Opportunity & Workflow AuditFind the decisions worth improving first.
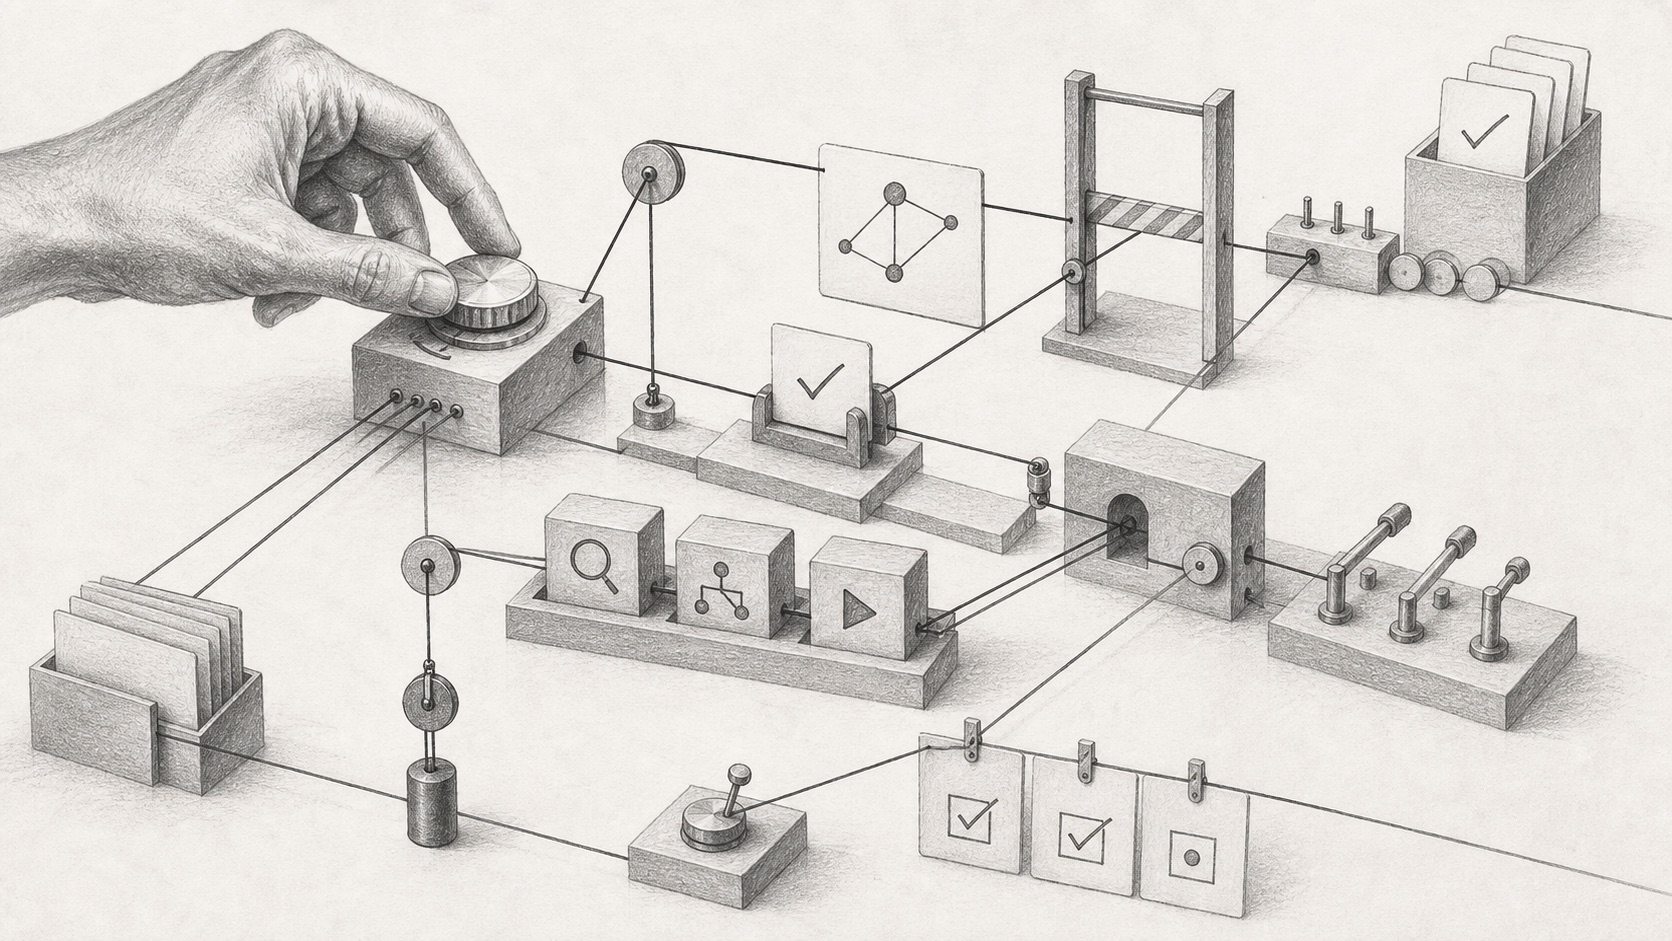
AI Agent Workflow SprintConnect decision systems to controlled agentic workflows.

Final CTA

Ready to move from AI idea to a working system?

Build a Decision Intelligence Dashboard